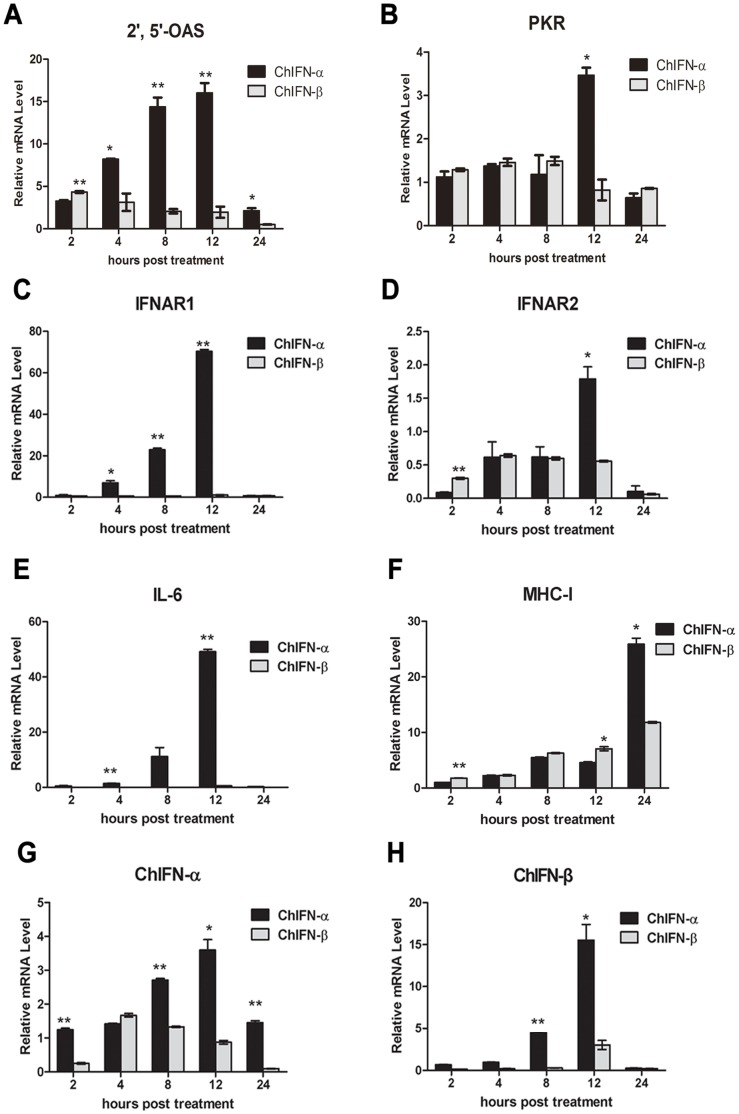
Figure 4. The greater induction potency of ChIFN-α than ChIFN-β on ISGs involved in host defense.
After DF-1 cells were incubated with 10 U/ml ChIFN-α or β, the cells were harvested at the indicated times post treatment for RNA extraction and cDNA preparation. The transcriptional levels of 2′,5′-OAS (A), PKR (B), IFNAR1 (C), IFNAR2 (D), IL-6(E), MHC-I (F), IFN-α (G) and IFN-β (H) were assayed by real time PCR. Data were shown as mean ± SEM (n = 3). The Mann-Whitney U test was used to compare the differences in relative mRNA levels between ChIFN-α and ChIFN-β treatments at the same time points. A value of P<0.05 was considered statistically significant. *P<0.05 and **P<0.01. The asterisks were masked on the top of higher columns.

