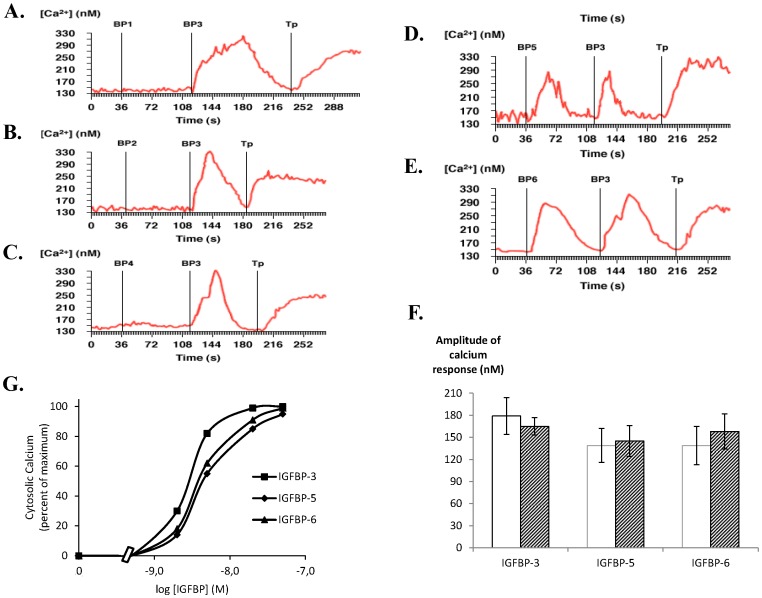
Figure 2. IGFBP-3, -5 and -6, but not IGFBP-1, -2 and -4, increase intracellular calcium concentration in C2 proliferative cells.
A-E. C2 cells cultured on glass coverslips were incubated with Fura-2/AM. After background recording for 40 seconds to determine basal intracellular calcium concentrations as described in Methods, cells were incubated with either 20 nM IGFBP-1 (panel A), IGFBP-2 (panel B), IGFBP-4 (panel C), IGFBP-5 (panel D) or IGFBP-6 (panel E), then with IGFBP-3 (20 nM) and then with thapsigargin (1 µM). The results of a typical experiment are shown in which the whole field (red line) was analysed and intracellular calcium quantified. Results presented are representative of 3 independent experiments. F. Quantitative analysis of the calcium response (maximal calcium response - basal calcium level) obtained for IGFBP-3, -5 and -6 in calcium free (empty bars) or calcium containing (hatched bars) medium. Results are the means ± SEM for three independent experiments. G. Dose-response curves for intracellular calcium concentrations were established as described in Materials and Methods. Values are expressed as percentages of the maximal response measured with 50 nM IGFBP-3 and are the mean for two independent experiments.

