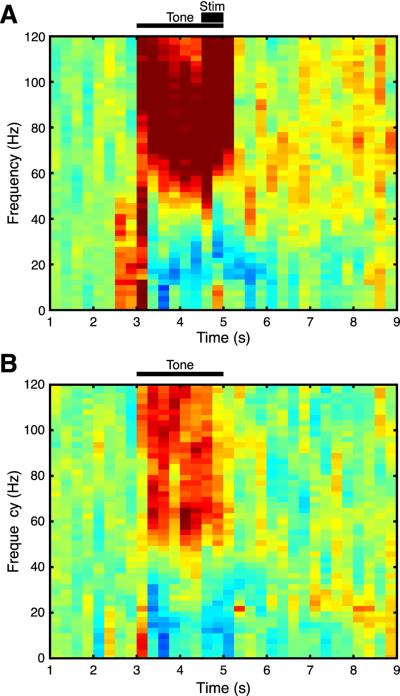
Fig. 10.
Average EEG spectral activity during presentation of (A) the CS+ and (B) the CS− during the training session (30 trials each CS+ and CS−). Tone presentation (2 s) is indicated by thin horizontal bar (A and B); BLA stimulation is denoted by short thick bar (A only). (Extremely intensive gamma activity (dark red) during and immediately following BLA stimulation reflects artifact.) Vertical color bar indicates amount of activity across the EEG spectrum. Gamma band = 40–120 Hz. Note the greater amount of gamma band activity to the CS+ (A) than the CS− (B), especially in “high gamma” band (60–120 Hz).

