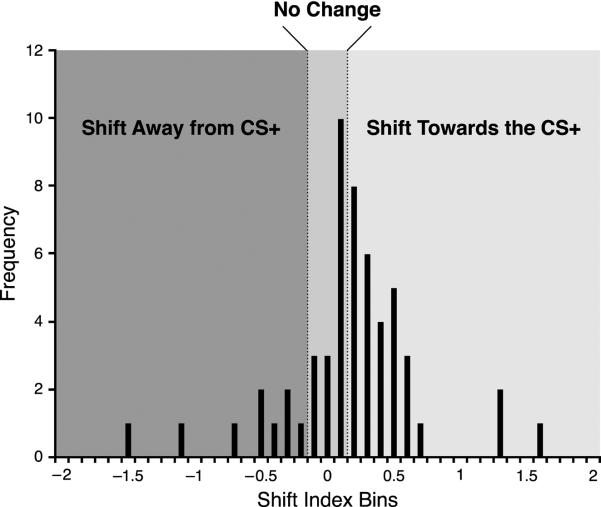
Fig. 3.
Group frequency distribution of the Week 1 average post training shift index at CF. The central area represents recording sites categorized as “No Change” (shift index [SI] less than or equal to 0.1). Positive values indicate shift towards the CS+, negative values indicate shift away from the CS+.

