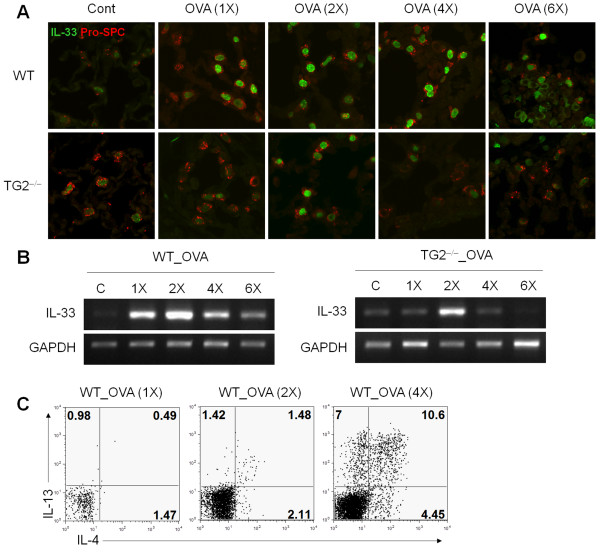
Figure 6.
Reduced IL-33 in TG2−/− mice. (A) Immunofluorescence staining of IL-33 (green) and pro-SPC (red) in the lung from WT and TG2−/− mice. Sections were prepared 24 h after OVA challenge. (original magnification, ×1000). (B) IL-33 mRNA expression in lung tissues of WT and TG2−/− mice were determined by reverse transcription-polymerase chain reaction. (C) BAL cells were harvested 24 h after OVA challenge and restimulated with PMA and ionomycin for 4 h. Intracellular cytokine levels were analyzed by flow cytometry. The proportions of IL-4- and IL-13-producing cells are shown.

