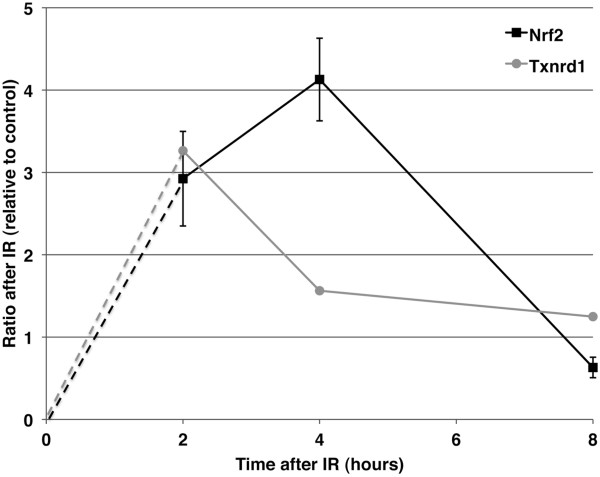
Figure 5.
Activation of the oxidative stress pathway seen in increased Nrf2 and Txnrd1 expression following IR. Nrf2 protein expression was determined by Western analysis and quantification of the average of data from 3 WT cell lines with each Nrf2 intensity pixel value normalized to β-actin. Error bars are standard error of the 3 WT ratios. Txnrd1 mRNA expression was determined by qRT-PCR and each data point is the final ddCT calculated fold change value from 3 WT cell lines, each with 3 to 5 technical replicates, following normalization to 18S.

