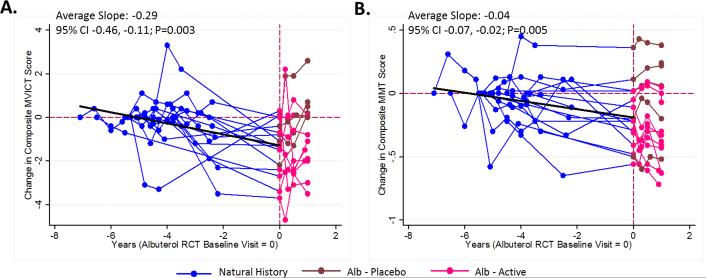
Figure 2.
Progression of disease as measured by composite MVICT score (A) and composite MMT score (B) for 15 subjects entered in the natural history study (blue) that later participated in the albuterol RCT (pink=active, maroon=placebo). The slope is estimated from a linear mixed effects model (see text for details) and includes measurements up to the albuterol RCT baseline visit. The time scale on the X-axis is in relation to the baseline visit in the albuterol RCT (time zero). Alb = albuterol; CI = Confidence interval.

