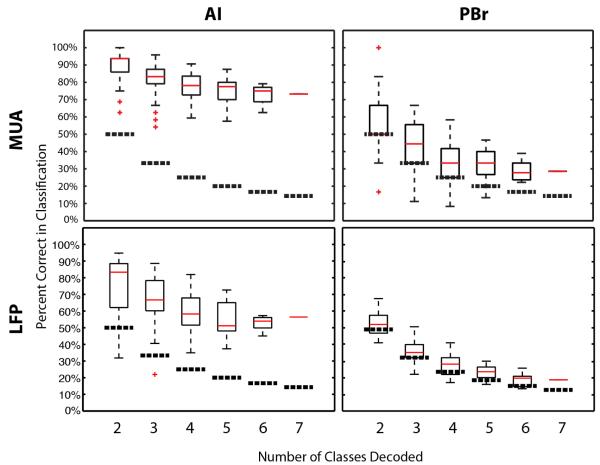
Figure 3.
Best classifier performance for MUA and LFP-based decodes. The top two panels show box plots for MUA-based decode performance for AI and PBr, while the bottom two show LFP-based decode performance. Mean performance is indicated by red lines across combinations of vocalizations for two through seven classes. Red crosses indicate outliers. Thick dotted lines indicate chance performance across vocalization combinations.

