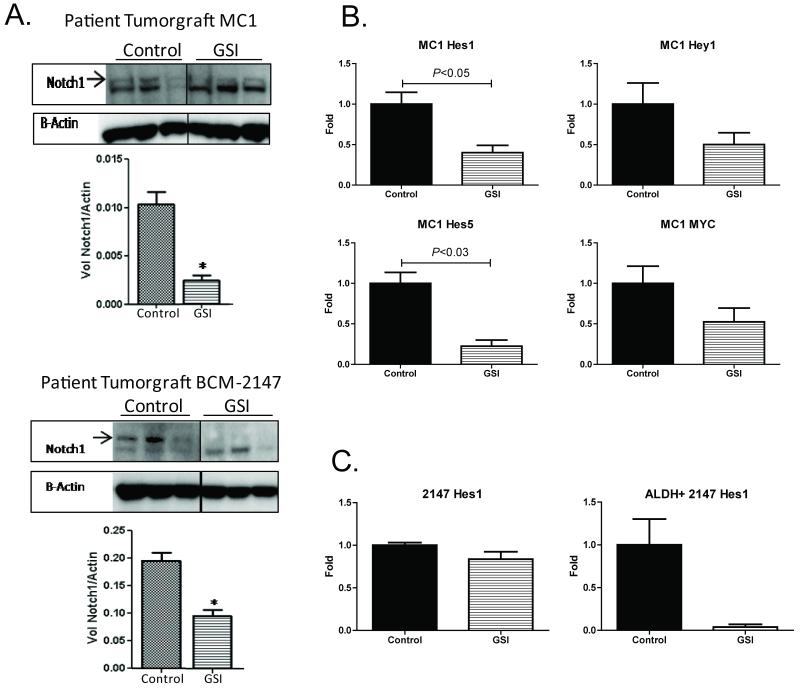
Figure 2. GSI inhibited the Notch pathway.
A. Western blot analysis confirmed inhibition the Notch Intracellular Domain (NICD) cleavage. Western blots were incubated with primary antibody against Notch1 or Beta-Actin. Cropped versions of the blots are shown. Image Quant LAS 4000 (GE Healthcare) hardware and software were used to capture multiple digital images over time so that band intensity could be quantitated in the linear dynamic range. The bar graph shows quantification of band intensity to determine NICD relative to Beta-Actin expression. Top panel, MC1; bottom panel, BCM-2147. B. GSI suppressed Notch pathway targets in MC1 tumors. Mice were treated with GSI (n=4) or vehicle (n=4) for two days before collection of tumor tissue on the third day. RTqPCR was performed using ABI Taqman Probes and Primer sets on the ABI 7900HT FAST instrument. Relative gene expression was calculated using the Relative Quantification (RQ) Method, comparing gene expression to 18S ribosomal RNA for each gene. Data is presented relative to the vehicle control. C. GSI suppressed the Notch pathway in the BCSC population. Left panel, relative Hes1 expression in whole tumor (n=3 per group). Right panel, relative Hes1 expression in sorted ALDH+ cells from BCM-2147 tumors (n=2 per group).

