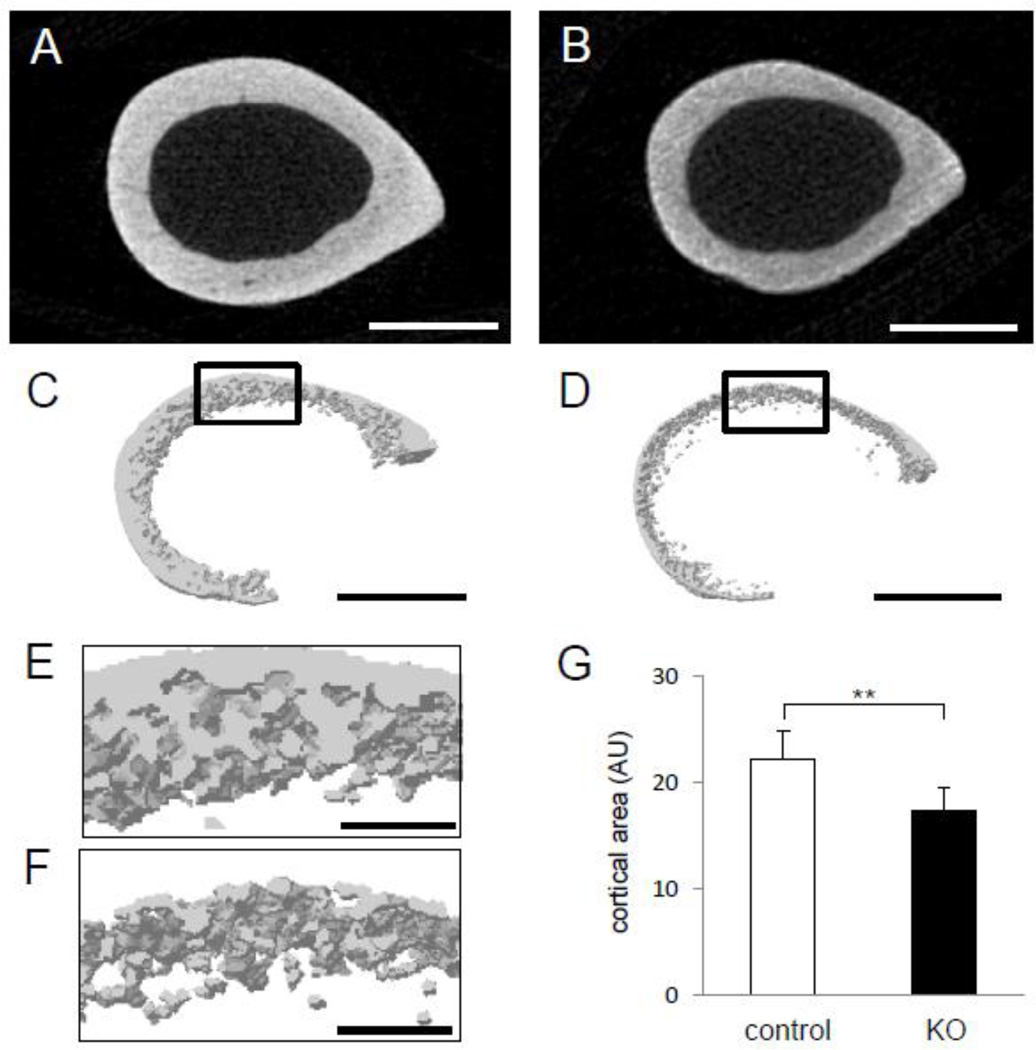
Fig. 3.
Photographs of µCT images on an appendicular skeleton. (A) Cross section of the femoral middle shaft in littermate controls (Lrp5f/f). (B) Cross section of the femoral middle shaft in mice lacking Lrp5 in osteocytes (Lrp5−/−). (C) 3D-reconstructed image of the midshaft section of littermate controls (Lrp5f/f). (D) 3D-reconstructed image of the midshaft section of mice lacking Lrp5 in osteocytes (Lrp5−/−). Scale bar = 500 µm in (A–D). (E) Magnified view of the focused (black rectangle) area in control animals depicting quality of cortical bone. (F) Magnified view of the focused (black rectangle) area in mice lacking Lrp5 in osteocytes depicting disrupted quality of cortical bone. (G) Graph depicting the cortical area of cross section of the femur by subtracting area of medullar cavity from the whole cross section. AU denotes arbitrary units or pixel2. n=9 for control and n=5 for KO mice. The error bars denote means ± s.e.m. The double asterisks, **, indicate p < 0.01. Scale bar = 100 µm in (E–F).

