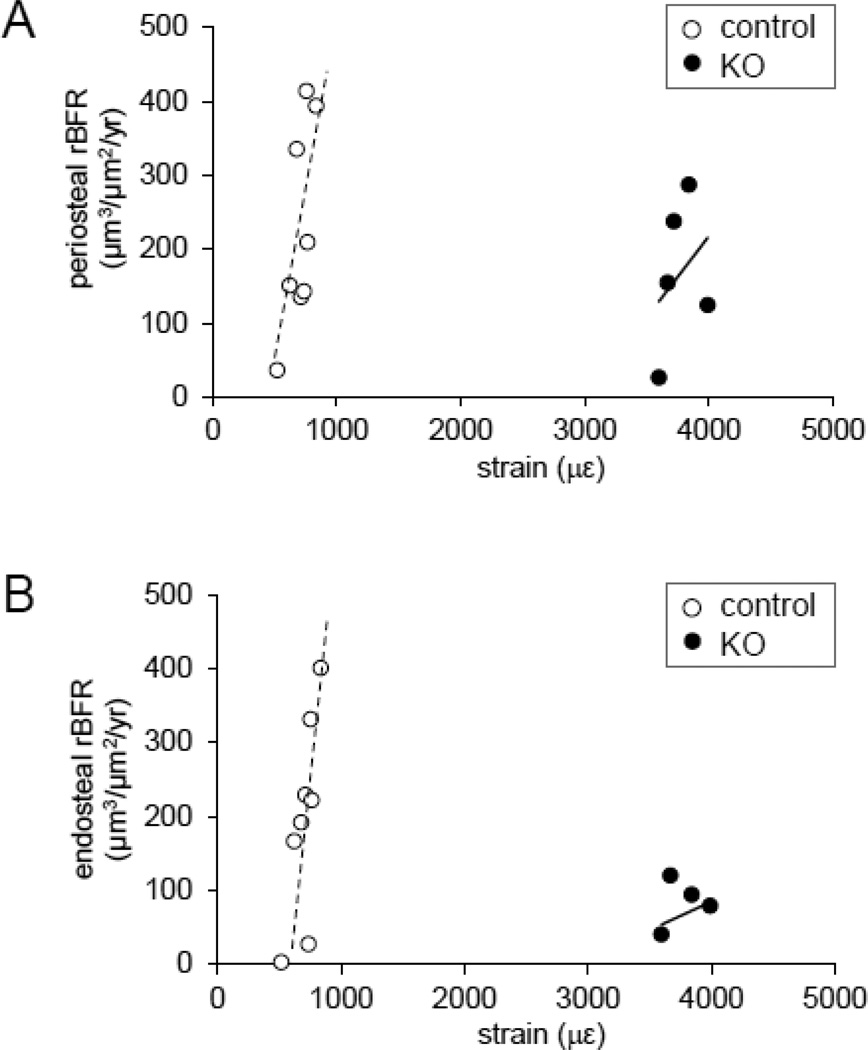
Fig. 7.
Ability to respond to normal tissue strains for mice lacking Lrp5 in osteocytes. (A) Graph depicting relative bone formation rate (rBFR) on the periosteal surface of the middle shaft ulna in response to applied mechanical strain in mice lacking Lrp5 in osteocytes as compared to the littermate controls. The dotted and solid lines denote linear regression and the coefficient of determination for controls and KO mice, respectively (y = 0.99x – 466, R2 = 0.49). (B) Graph depicting relative bone formation rate (rBFR) on the endosteal surface of the middle shaft ulna in response to applied mechanical strain in mice lacking Lrp5 in osteocytes as compared to the littermate controls. The dotted and solid lines denote linear regression and the coefficient of determination for controls and KO mice, respectively (y = 1.03x – 528, R2 = 0.55).

