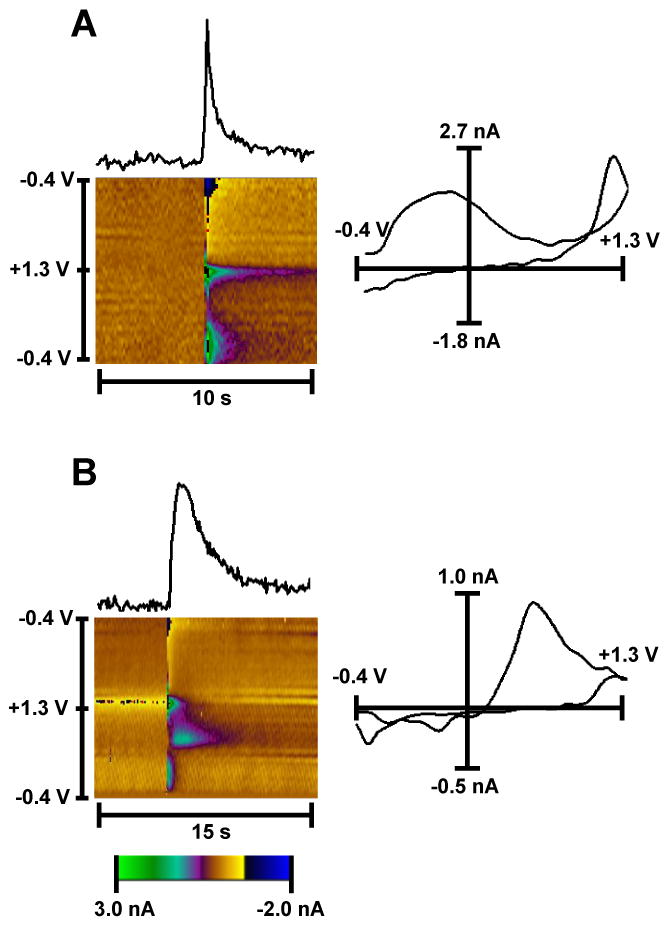
Figure 3. Recording artifacts observed with optical stimulation in striatal slices.

Electrochemical signals and color plots demonstrating artifacts, which were observed without (A) and with (B) dopamine detection and regularly encountered during blue light stimulation. Panel A shows the artifact detected from an area that did not have any visible ChR2 containing terminal. The color plot and cyclic voltammogram revealed no electrochemical characteristics for dopamine identification (there are no oxidation and reduction current peaks, when +0.6 V and −0.2 V were applied). Panel B shows dopamine signal contaminated with a similar artifact. These recordings were made from an area with high intensity of the EYFP signal. In this case, the background subtracted cyclic voltammogram clearly demonstrates that the signal obersved is dopamine. The color depicts additional changes in the background-subtracted faradaic current (in pseudocolor), which are not associated with dopamine detection.
