Figure 2.
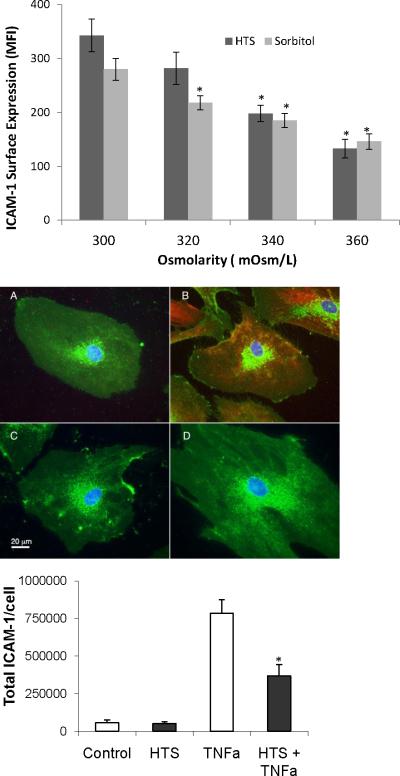
Hypertonic saline or sorbitol inhibits TNFα-stimulated ICAM-1 surface expression(top panel). ICAM-1 expression at the cell surface is measured by flow cytometry. Data are expressed as mean±SEM of 5 experiments. HMVECs were incubated in media with varying Na+ or sorbitol concentrations to increase osmolarity from 300 to 320, 340,or 360 mOsm/L and then stimulated with TNFα (10 ng/ml) for 6 hrs. Control is represented by the 300 mOsm/L treated cells. *denotes difference from 300 mOsm/L control (p<0.05).
Middle panel represents total ICAM-1 surface expression in permeabilized cells as measured by quantitative wide field microscopy. Green channel shows cellular glycoproteins stained with WGA, red shows ICAM and blue shows nuclei. The images show representative cells at at 6 hours. (A)Control untreated cells, (B) TNFα treated for 6 hours, (C) cells treated with HTS alone (360 mOsm/L), and (D) cells treated with TNFα + HTS (360mOsm/L), also at 6 hours. Bottom panel shows total cellular ICAM obtained from compiling quantitative fluorescence microscopy of 10 fields/group (such as shown in Fig 2b) totaling >33 cells/group. *denotes difference from isotonic TNFα treated group (p<0.05)

