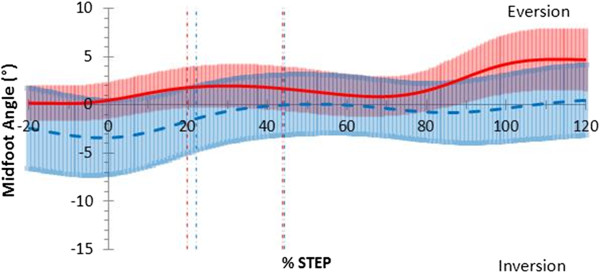
Figure 8.

Frontal plane midfoot motion in jogging gait. Mean joint angles for barefoot (red) including 95% confidence intervals (red shading) and thong (blue dashed) including 95% confidence intervals (blue shading), including 20% before and 20% after stance (y-axis), while jogging. Events foot-flat and heel-rise represented by the vertical red (barefoot) and blue (thong) dashed lines.
