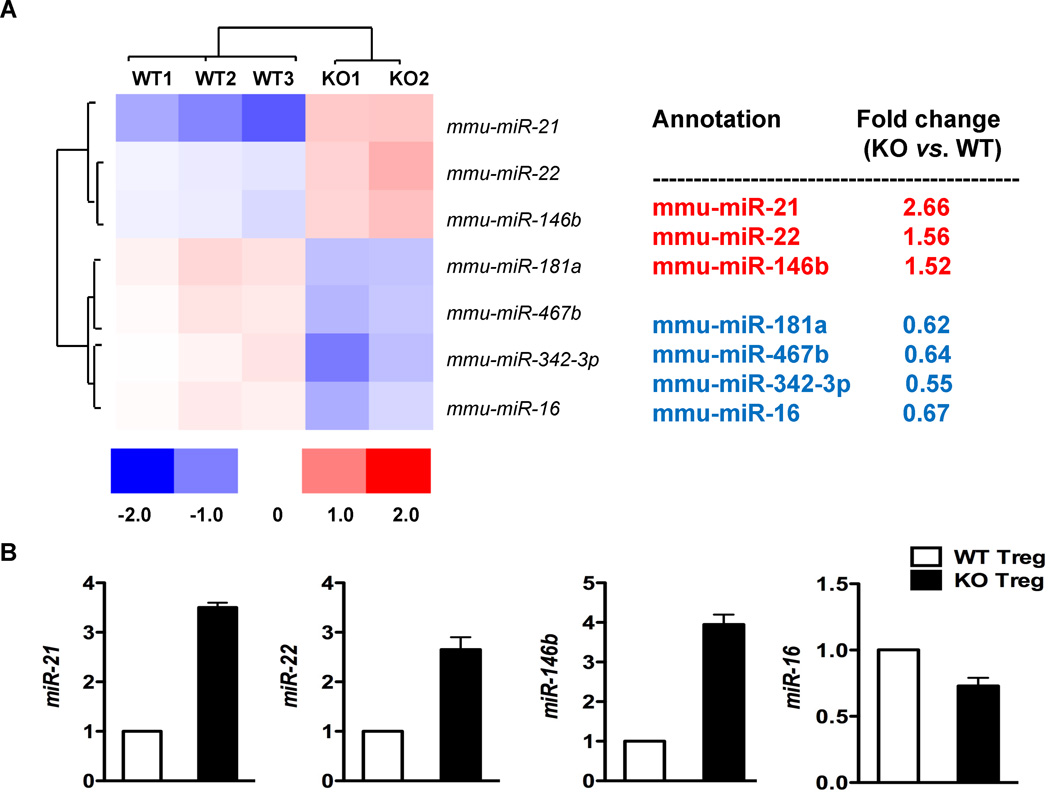
Figure 1. Bcl6 represses miR-21 in Tregs.
A. The heat map shows miRs differentially expressed with statistical significance between sorted Bcl6−/− and wild-type Tregs, analyzed by expression microarrays. The color scale shown at the bottom illustrates the relative expression level of a miR across all samples: red color represents an expression level above mean, blue color represents expression level lower than the mean. N = Tregs from 3 wild-type mice and 2 Bcl6−/− mice.
B. Validation of miR expression in Bcl6−/− and wild-type Tregs by QPCR assay. N= Tregs from 2 wild-type mice and 2 Bcl6−/− mice.

