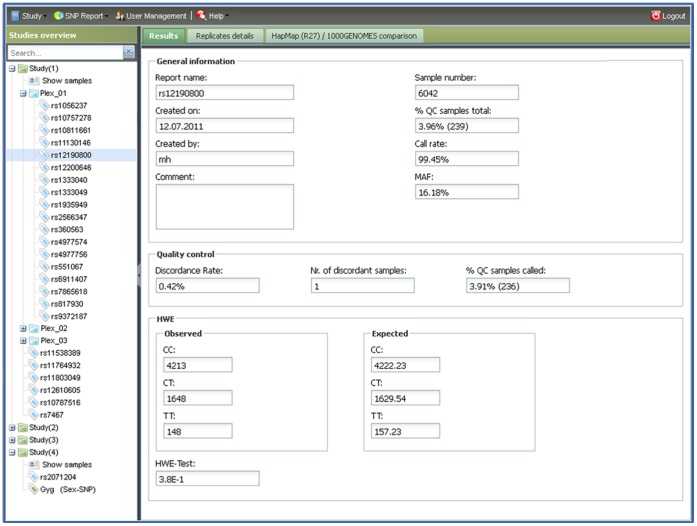
Figure 1. Main interface of SNPflow.
This figure shows the main interface of SNPflow. The left panel illustrates the different studies with the respective SNP reports. iPLEX Assays are grouped into subfolders, (e.g. “Plex1”) while TaqMan results are reported as single documents (e.g. “rs2071204” in “Study (4)”). Specific SNP results can be retrieved with the search field in the study overview. The right panel contains three tabs showing the QC data, detailed replicates analysis and the comparison with HapMap release 27 and the 1000 Genomes Project phase 1 (see also figure 4). The tool bar with the different options is located on the top of the window.

