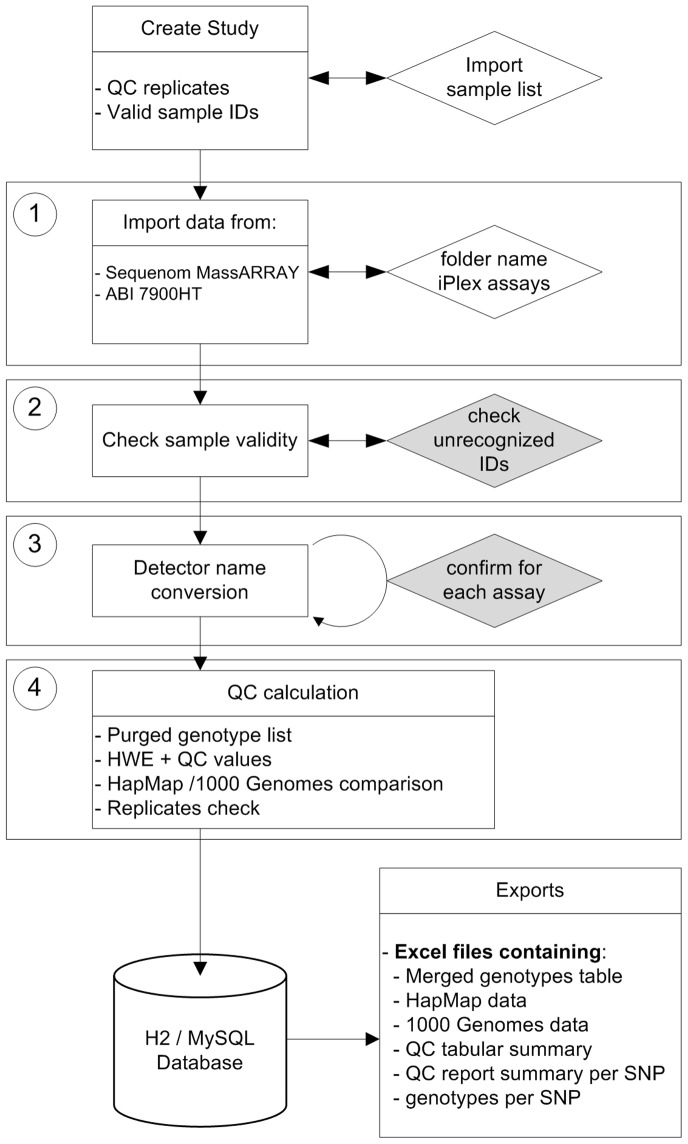
Figure 2. Flow chart of the main data processing workflow.
User actions are depicted as diamonds. The two shaded diamonds represent the two major data checkpoints as described in the subsection “Processing of genotyping data” in the “Workflow” section of the main text. The numbers of the four boxed steps correspond to the steps of the four SNPflow data analysis wizard (see also figure 3). For a detailed description of this flow chart, please see the section “Workflow” in the manuscript.

