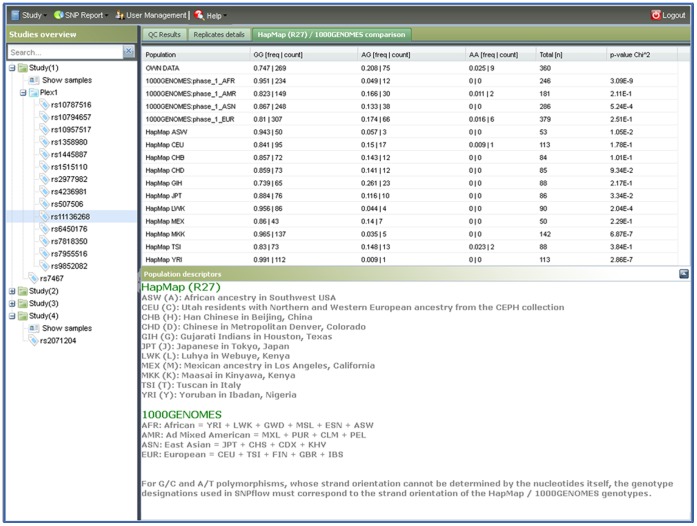
Figure 4. SNPflow’s HapMap/1000Genomes comparison panel.
This figure exemplifies the HapMap/1000Genomes comparison. Both, frequencies and absolute genotype numbers are reported for each population. A Pearson chi square test checks the concordance with the user’s data. The user can look up the most appropriate HapMap population as well as the super populations from the 1000 Genomes Project and perform an additional plausibility check of the generated genotypes.

