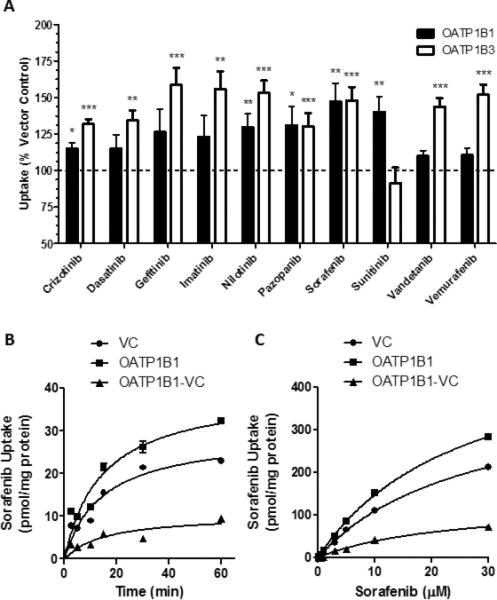
Figure 1. Transport of sorafenib by OATP1B transporters.

A) [3H]-Labeled TKIs (0.1 μM) were incubated with HEK293 cells expressing OATP1B1, OATP1B3, or vector control (VC) for 30 min. Intracellular concentrations of drug were determined by liquid scintillation counting. Data represent the mean ± SE of two experiments with triplicate samples (n=6) (*, P<0.05; **, P<0.01; ***, P<0.001). B, C) T-Rex293 cells expressing OATP1B1*1A or VC were incubated with 0.1 μM for the indicated time (B) or the indicated concentration of [3H]sorafenib for 15 min (C). Data represent the mean sorafenib uptake (symbols) ± SE (error bars, shown when larger than symbol) of triplicate samples (n=3). VC represents the cells transfected with an empty vector, representing background transport. The OATP1B1-VC data points, representing the specific contribution of OATP1B1 to the observed transport of sorafenib, were determined by averaging the triplicate values for each group, then subtracting the uptake values obtained in cells transfected with VC from the uptake values obtained in cells expressing OATP1B1.
