
Figure 1. Generation of Snx5-deficient mice.
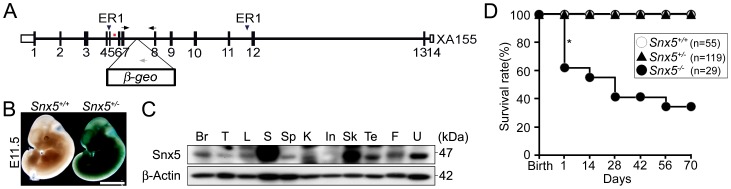
(A) Schematic drawing of the Snx5 gene-trapped (XA155) allele. Arrows indicate the genotyping primers, and the 2 arrowheads indicate the ER1 (EcoRI) digestion sites. The red bar represents the probe for Southern blotting. (B) Whole-embryo X-gal staining at E11.5. Scale bars: 2.5 mm. (C) Western blot analysis of the indicated mouse tissues (Br, brain; T, thymus; L, lung; S, stomach; Sp, spleen; K, kidney; In, intestine; Sk. skin; Te, testis; F, fat; U, uterus). (D) Survival rate of mice after birth. The asterisk shows the dramatic mortality observed in the neonatal stage.