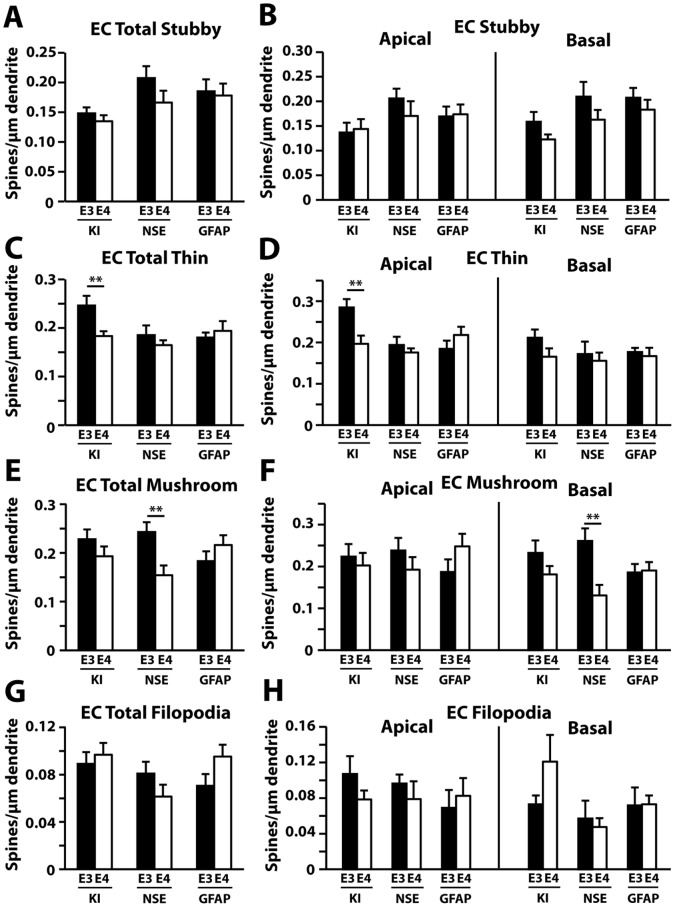
Figure 8. Quantification of spine subtypes in the entorhinal cortex (EC) in different apoE mouse models at 19–21 months of age.
(A–H) Averaged densities of stubby (A–B), thin (C–D), mushroom (E–F), and filopodia (G–H) type protrusions in the entorhinal cortex for all genotypes. Values are mean ± SEM, n = 20–33 neurons from 3–5 mice for each group. **p<0.01.

