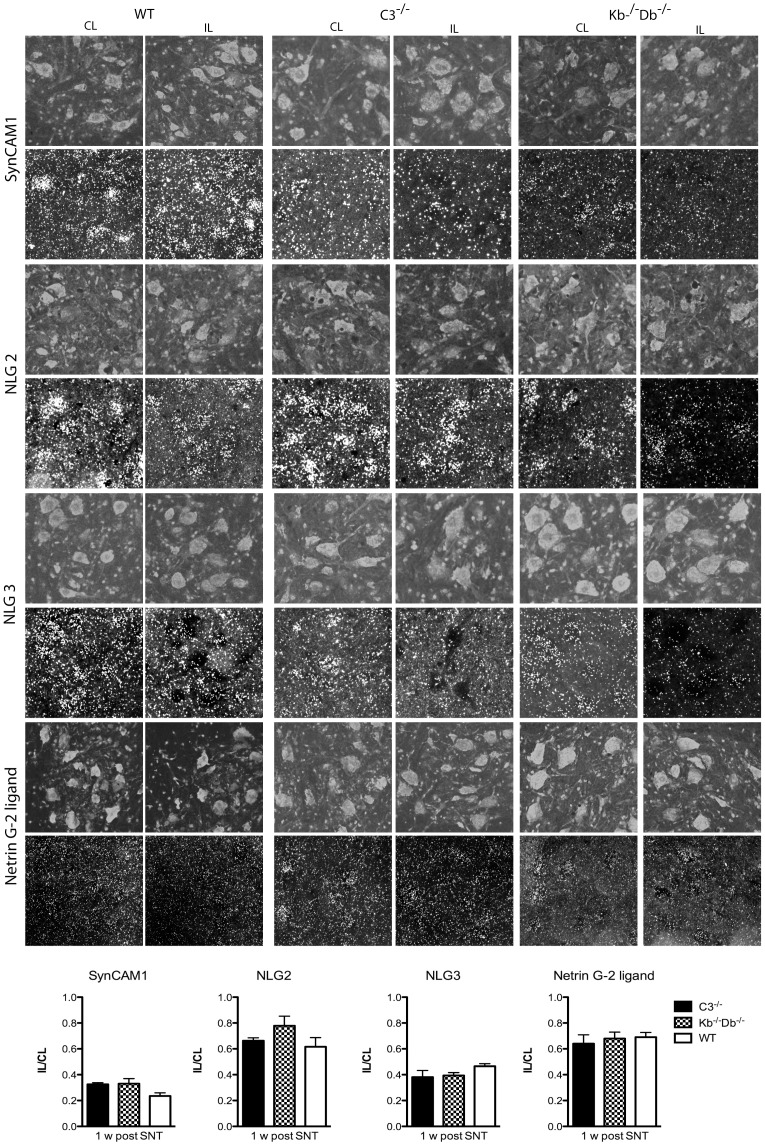
Figure 4. No difference in mRNA signal of SynCAM1, NLG-2, -3 and NGL-2 between WT (first column), C3−/− (second column) and Kb−/−Db−/− mice (third column) one week after sciatic nerve lesion.
ISH signal for SynCAM1 (first row), NLG-2 (second row), NLG-3 (third row) and NGL-2 (fourth row) mRNAs could be seen over motoneuron cell bodies visualized with bisbenzemide in the dorsal part of the ventral horn of the spinal cord. mRNA expression of all studied adhesion molecules decreased after axotomy but no difference was seen between the different mouse lines (quantified in right column ). Error bars indicate SEM, one-way ANOVA with Bonferroni’s multiple comparison test. Five animals were studied in each group. Scale bar = 50 µm.

