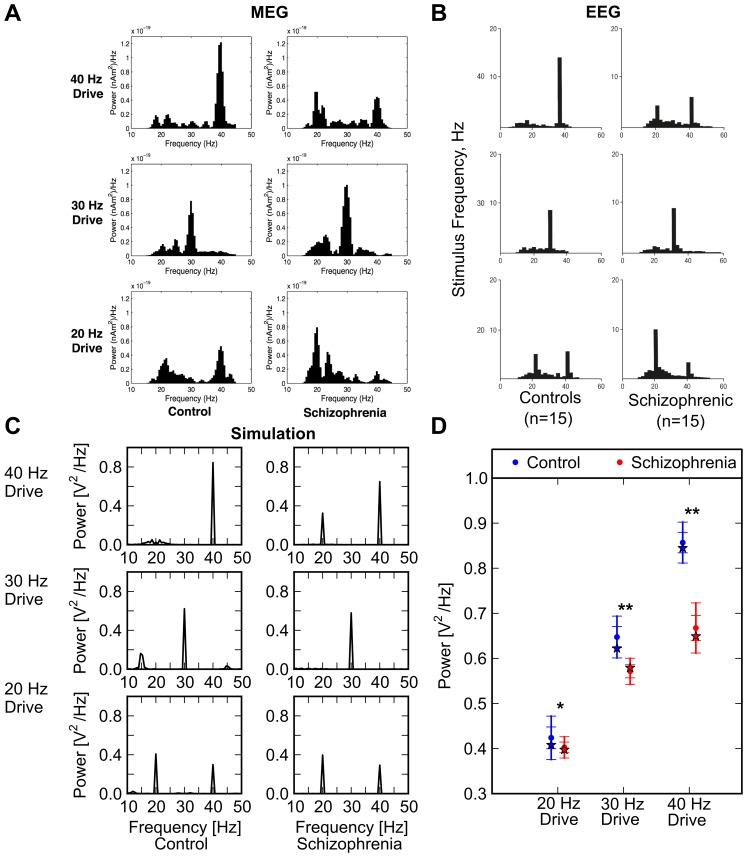
Figure 1. Brain oscillatory activity from clinical magnetoencephalographic (MEG) and EEG studies, and output of computational model.
(A) Control subjects (left three histograms) and schizophrenic patients (right three histograms) were exposed to auditory click trains at 20, 30, and 40 Hz. Resultant MEG power spectra are shown (from Vierling-Claassen et al [54]). (B) The same experimental conditions as (A) above were used, but EEG activity was recorded (from Kwon et al [41]). (C) Simulated EEG power spectra from model when driven at 20, 30, and 40 Hz. Note correspondence with clinical data of panels (A) and (B). (This is the “primary point model”, as defined in Fig 2.) (D) Graph of power spectrum peaks from index schizophrenic patient of panel (C) plus 20 simulated patients (in red), and index control patient of panel (C) plus 20 simulated control subjects (blue). In all cases, index patient is indicated by a star; simulated patient averages are indicated by dot, and one and two standard deviations are shown by tick marks on error bar. Although computational model outcomes are not strictly analogous to data from clinical studies [59]-[61], we have calculated p-values, by convention (* p < 0.01, ** p < 0.001). Note that Group x Frequency interaction was highly significant, due to the fact that group differences were largest at 40 Hz; please see text for additional details of statistical analysis.

