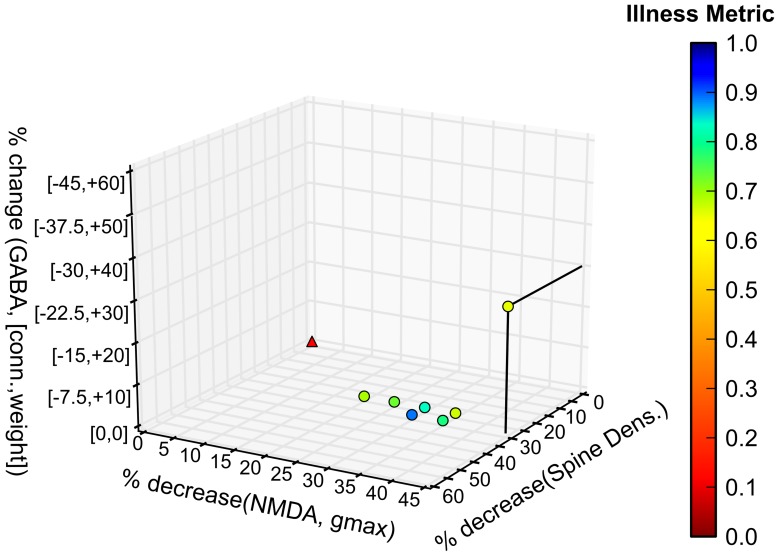
Figure 2. Model output showing unique combinations of abnormalities that may give rise to the schizophrenic phenotype.
Degree of GABA system dysregulation, extent of NMDA hypofunction, and spine density decrease are shown on the axes, respectively. Origin (0, 0, 0) represents the control (unaffected) condition. The degree to which model outputs match experimental findings (illness metric) is indicated via color scale. All model outcomes with illness metric > 0.65 are shown.

