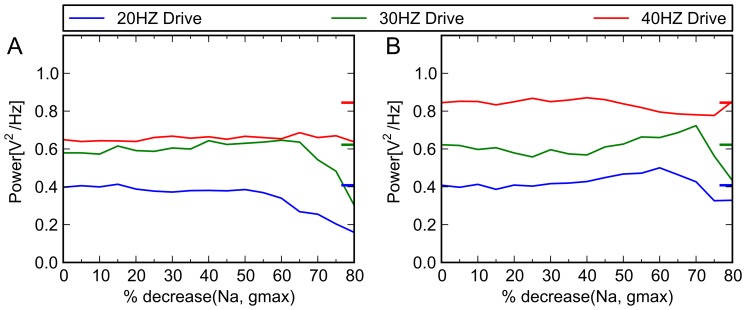
Figure 6. Simulated effects of phenytoin on control and schizophrenic models.
The therapeutic dose range for phenytoin is 10–20 mg/L, (40–80 µmol/L [62]). Lampl et al [63] and others [64], [65] have shown that phenytoin concentrations in this range produce a decrease in Na+ channel conductance of between 34% and 50%. Above, x axis indicates percent reduction in conductance of Na+ channel, and y axis indicates the power in given frequency band of the model when driven at 20, 30 and 40 Hz. Colored tick marks on right border of graphs indicate oscillatory behavior characteristic of control subjects (A) Schizophrenic model. When we implement virtual medication doses, by gradually decreasing gmax of the Na+ channel, no ameliorative effect (i.e., specific increase in 40 Hz activity) was seen. (B) Control model. There are no known clinical studies that are precisely comparable to the experimental paradigm we have used—that is, studies of control subjects receiving phenytoin at various doses, who receive auditory click train stimulation at 20, 30, and 40 Hz. However, studies that have looked at resting EEG activity at therapeutically relevant doses have shown that it tends to increase 20 Hz activity [64], and have inconsistent effects on frequencies in the 30 Hz range [66], [67]; it was not seen to have a significant gamma band effect. Also, laboratory experiments using kainite-induced gamma oscillations in hippocampal slice preparations showed that therapeutic levels of phenytoin (50 μM) had no effect on gamma oscillations (p = 0.05) [68]. When applied to our control model at the above doses, we achieve similar effects.

