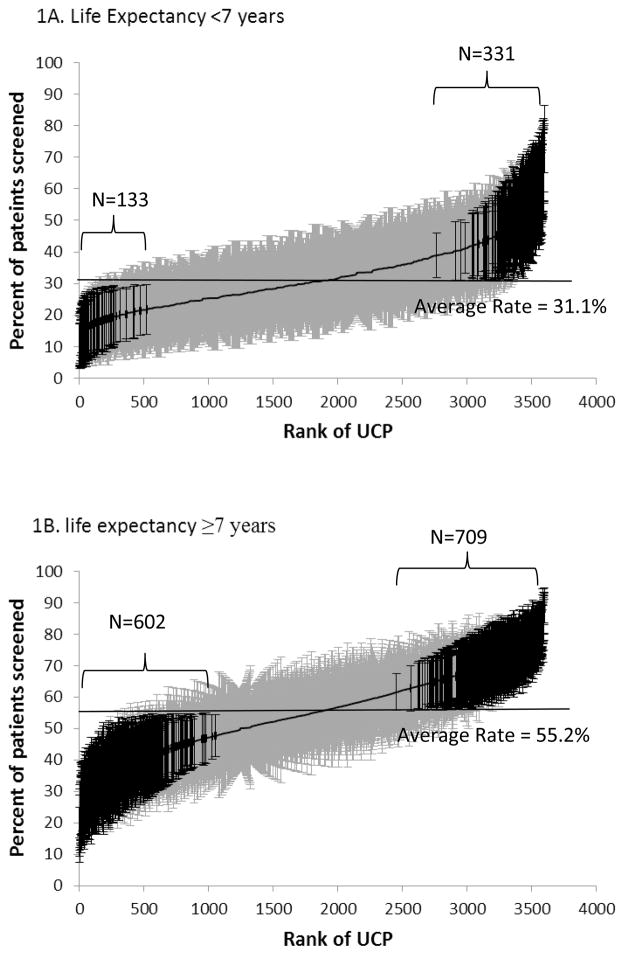
Figure 1.
Cumulative distribution of 3595 usual care providers (UCPs) by the rates of screening mammography of their patients in 2008–09. Figure 1A includes the rates for women with an estimated life expectancy of <7 years and Figure 1B includes women with an estimated life expectancy of ≥7 years. Adjusted screening rates and 95% confidence intervals for each UCP are shown, derived from a multilevel null model. UCPs were ranked from 1 to 3595 (horizontal axis) by their screening rates (vertical axis). The UCP with a rank of one had the lowest screening rate, while the UCP with a rank of 3595 had the highest screening rate. UCPs with rates significantly different from the average are indicated with dark ink.

