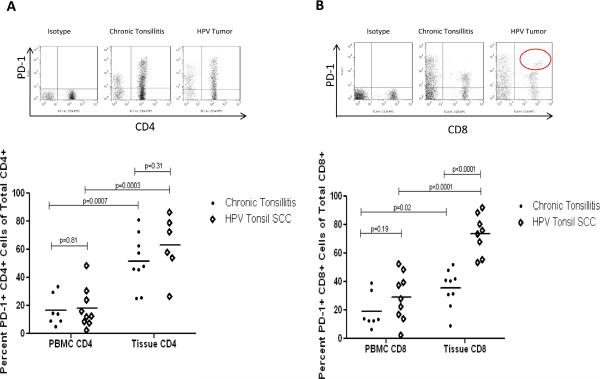
Figure 2. High levels of PD-1 receptor on TILs from HPV-HNSCC.
A. Representative flow cytometry of CD4+ T cell population expressing PD-1 in various tissues. Summary graph with mean frequency of CD4+PD-1(+) T cells in non-cancerous tonsils and HPV-HNSCC as compared to peripheral blood. B. Similar analysis performed for CD8+PD-1(+) T cell population. The circle on the representative flow data highlights a subpopulation of CD8+ TILs with high levels of PD-1 expression which was not observed in benign tonsils. (•) denotes chronic tonsillitis specimens and (◇) denotes HPV-HNSCC.

