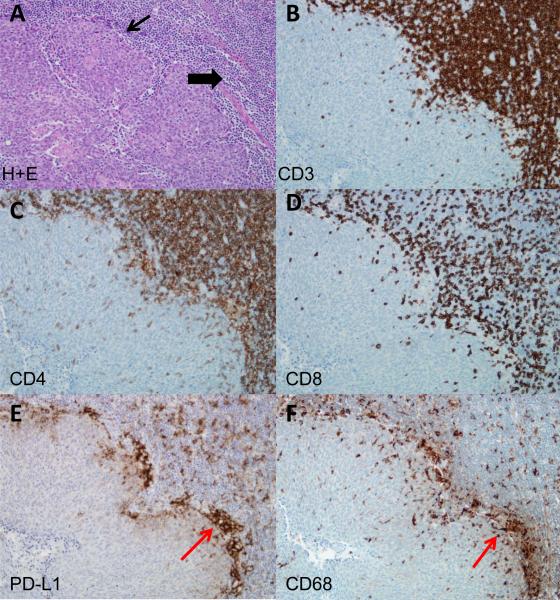
Figure 4. Co-localization of TILs with PD-L1 expression in HPV-HNSCC.
A. Hematoxylin and eosin stain of HPV-HNSCC (thin arrow marks tumor nests and thick arrow marks inflammatory stroma). Serial sections evaluated for: B, CD3; C, CD4; D, CD8; E, PD-L1; and F, CD68 expression. Red arrows indicate a representative area with clusters of PD-L1 and CD68 expression in serial sections (E, F). Magnification, 400x.

