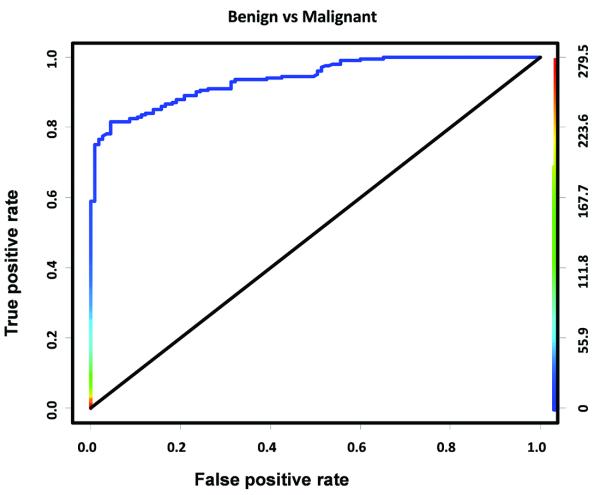
Figure 6.
ROC curve for differentiating benign histological entities (normal and hyperplasia) from malignant entities (DCIS and invasive cancer) at molecular ultrasound imaging threshold level of 4.6 a.u. Colored scale bar on right represents VEGFR2-targeted ultrasound molecular imaging signal in arbitrary units (a.u).

