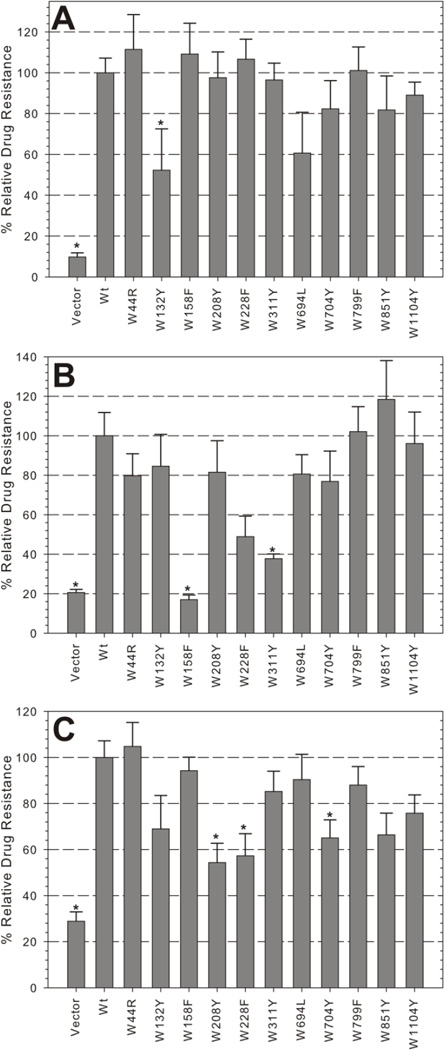
Figure 3. Fungicidal resistance profiles of single Trp mutant expressing yeast strains.
Mutant and control strains were analyzed for resistance to 75 µM (A) valinomycin, 65 µM fluconazole (B), and 25 µM doxorubicin (C) as in Figure 2B. Bars indicate the mean relative growth ± SEM of duplicate samples from four independent experiments, normalized to Wt relative growth. (*) indicate mutants that were significantly different than Wt (p<0.05).

