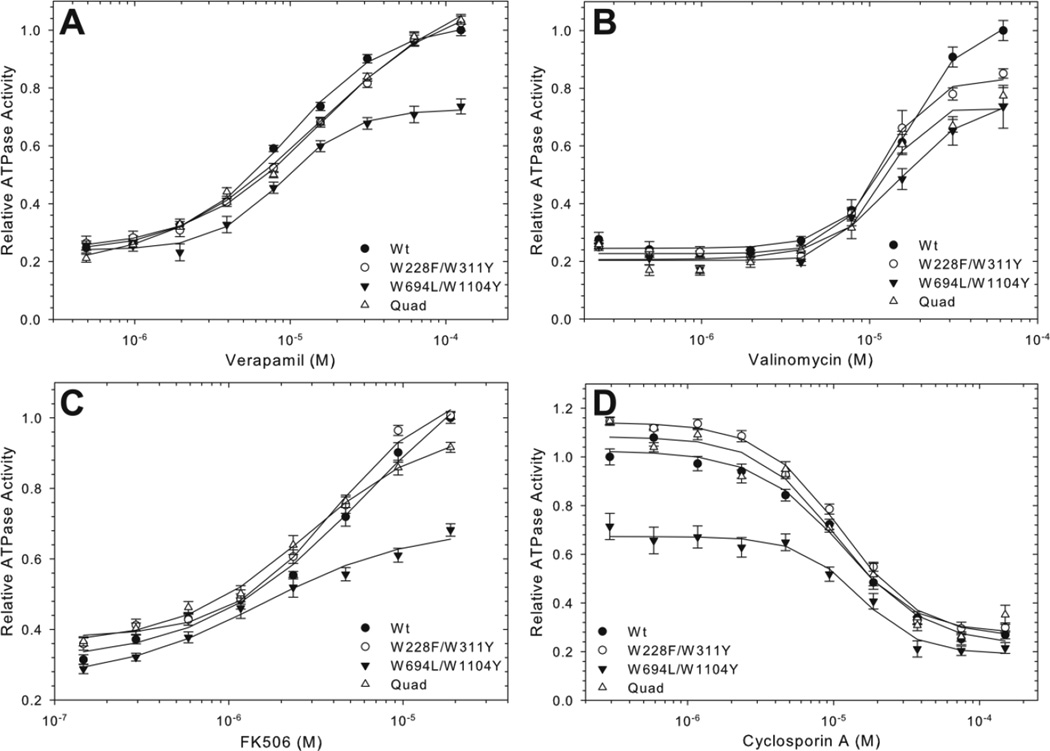
Figure 6. Drug stimulate/inhibited ATPase activity of purified Trp mutant protein.
Wt and mutant proteins were assayed for ATPase activity in increasing concentrations of verapamil (A), valinomycin (B), FK506 (C), and cyclosporin A with 150 µM verapamil (D). Data points indicate the average specific activity from multiple time points ± SEM from at least four independent experiments, relative to the maximum Wt activity. Where not visible, error bars are smaller than the symbols. Lines represent non-linear regression analysis of the data points with a Hill equation. R2 values for the data fits were between 0.97 and 0.99. Kinetic parameters of the data fits are given in Table 1.

