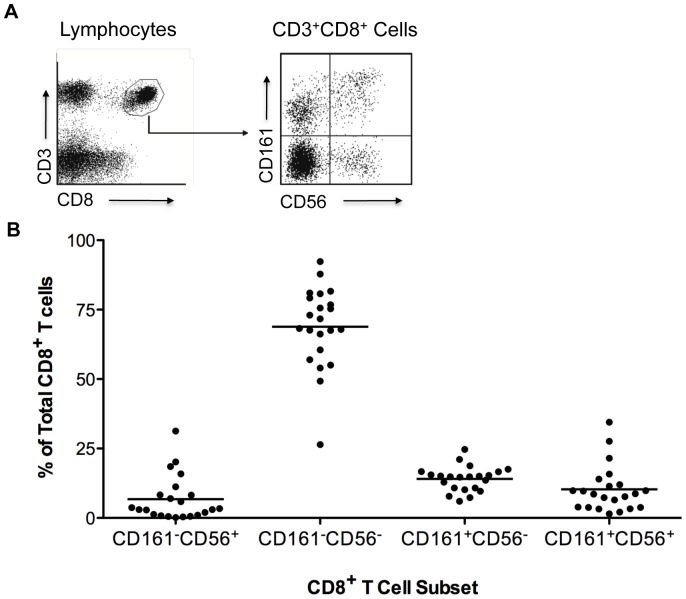
Figure 1. CD161−CD56+ CD8 T cell subset in normal PBMC.
(A) Existence of CD161−CD56+ CD8 T cell subset in normal PBMC. Flow cytometric analysis of cell surface expression of CD3, CD8, CD161 and CD56 on PBMC from healthy donors. The left plot was gated on lymphocytes and the right plot on CD8 T cells. Plots are representative of PBMC from 22 healthy donors. (B) Percentage of CD161−CD56+ CD8 T cells in total CD8 T cells. Each dot represents one individual (n = 22). Horizontal bars indicate the mean. Cell subset gating was as shown in part (A) right plot.

