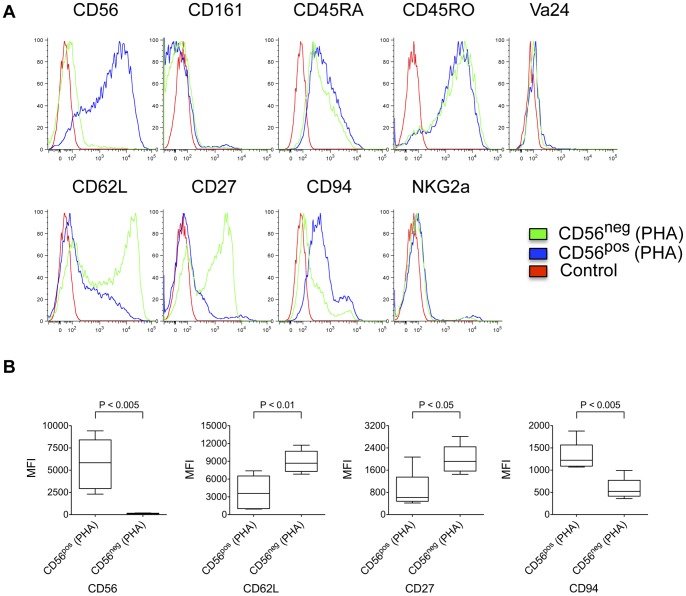
Figure 5. Cell surface phenotype of PHA-activated CD8 Treg.
(A) Representative histograms for cell surface antigen expression on PHA activated CD8 Treg (CD56pos) and CD8 Tcon (CD56neg). CD56pos and CD56neg cells isolated from PBMC were stimulated with PHA and cultured in the presence of feeder cells for 8 days before being analyzed for cell surface marker expression as described in Materials and Methods. Data shown are from one of 5 representative healthy donors. (B) Activated CD56pos cells maintained high expression of CD56 and CD94 and lower expression of CD62L and CD27. CD8 Treg (CD56pos) and CD8 Tcon (CD56neg) cells isolated from PBMC were stimulated with PHA and cultured in the presence of feeder cells for 9 to 16 days before being analyzed for intensity of expression of CD56, CD62L, CD27 and CD94 cell surface antigens. p-value was calculated with unpaired two-tailed Student’s t-test. Mean and standard deviation are shown (n = 5).

