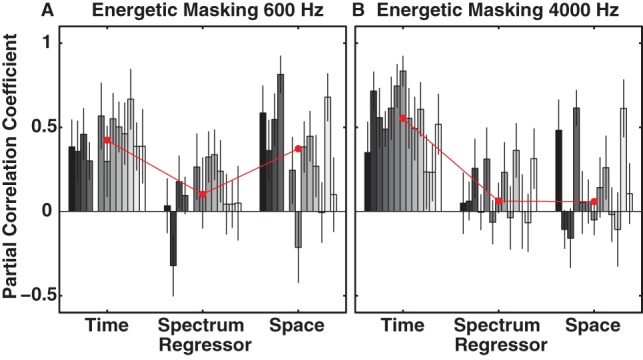
Figure 6. Partial correlation coefficients (weights) for regressors temporal onset (time), masker type, i.e. eC and eR (spectrum), and spatial separation between signal and masker (space) as obtained by multiple linear regression.

Results for the 600-Hz and 4000-Hz signal with energetic maskers for individual subjects (bars in different shades of gray) are shown in A and B, respectively. Error bars indicate 95% CIs and the red line with circular markers depicts the median across all subjects. Values close to 1 (0) indicate a strong positive (weak) weight of a given regressor. Subject order as in 1.
