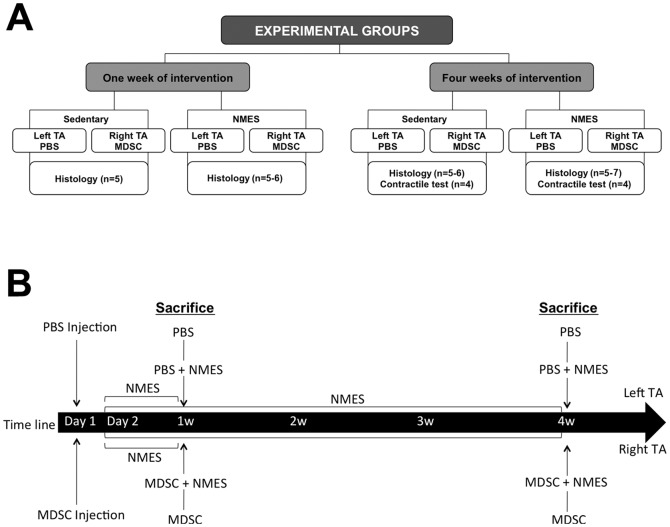
Figure 1. Schematic representation of the experimental groups and study design.
(A) Schematic representation of the experimental groups. All interventions were performed for 1 or 4 weeks. For each time point, animals were randomly divided into 2 groups: Sedentary and/or NMES. For all animals, the left TA was injected with PBS and the right TA injected with MDSC. Muscles were collected for histological (1 and 4 weeks) and contractile analyses (4 week only). (B) Schematic representation of the experimental design.

