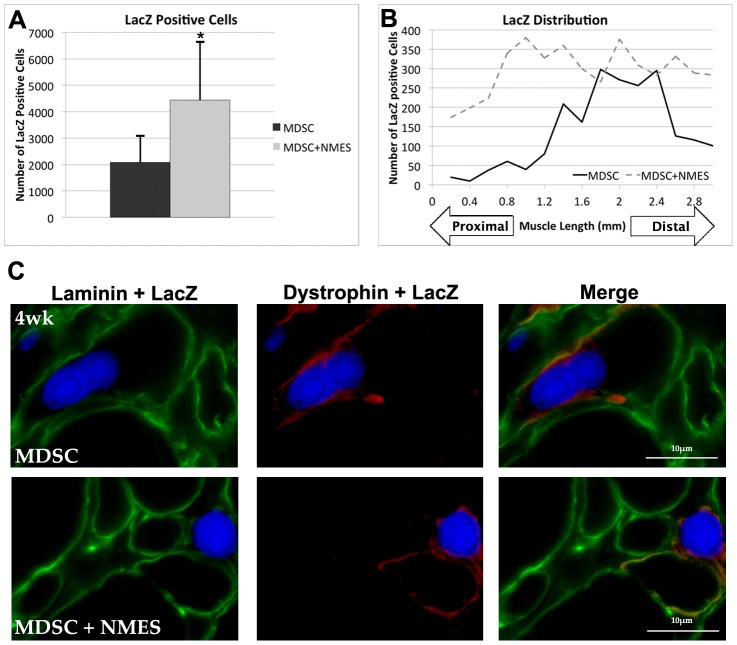
Figure 4. LacZ positive cells among experimental groups.
(A) Total number of LacZ positive cells (B) LacZ distribution in the MDSC and MDSC+NMES 4-week groups across 4 mm of the muscle (n = 6–7/group). (C) LacZ, laminin and dystrophin staining in the tissue cross-sections of TA muscles in MDSC and MDSC+NMES 4-week groups (60× magnification, scale bar = 10 µm). * Denotes significantly different when compared to PBS 1-week control (p<0.05). § Denotes significantly different when compared to PBS 4-week group (p<0.05).

