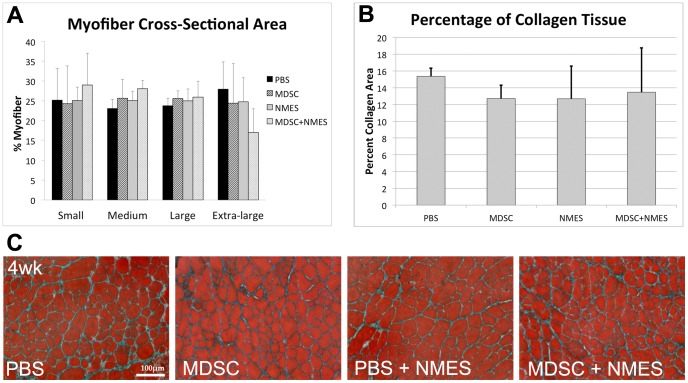
Figure 6. Effect of in vivo MDSC transplantation and NMES on cross-sectional area of host myofibers and percent of collagenous tissue.
(A) Distribution of myofibers in each group classified as ‘small’, ‘medium’, ‘large’ and ‘extra-large’, expressed as percentage. (B) Percent of collagenous tissue across experimental groups. (C) Masson's Trichrome stain in the tissue cross-sections of TA muscles of mdx mice 4 weeks after transplantation (20× magnification, scale bar = 100 µm).

