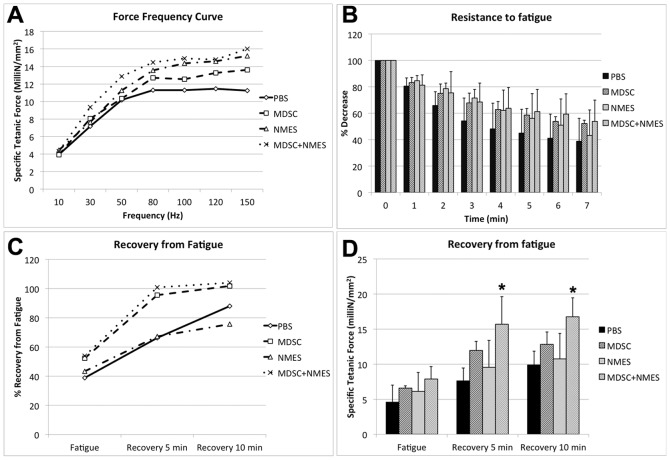
Figure 7. In situ contractile testing of the lower leg anterior compartment muscles (n = 4 per group).
(A) Force-frequency curve. (B) Resistance to a 7-min fatigue protocol. Data are presented as percent force decrease compared to the first muscle contraction. (C) Recovery from fatigue after 5 and 10 minutes. Data are presented as percent force compared to the initial muscle contraction at the start of the fatigue protocol. (D) Recovery from fatigue after 5 and 10 minutes, expressed as specific tetanic force. * Different when compared to PBS and NMES groups (p<0.05).

