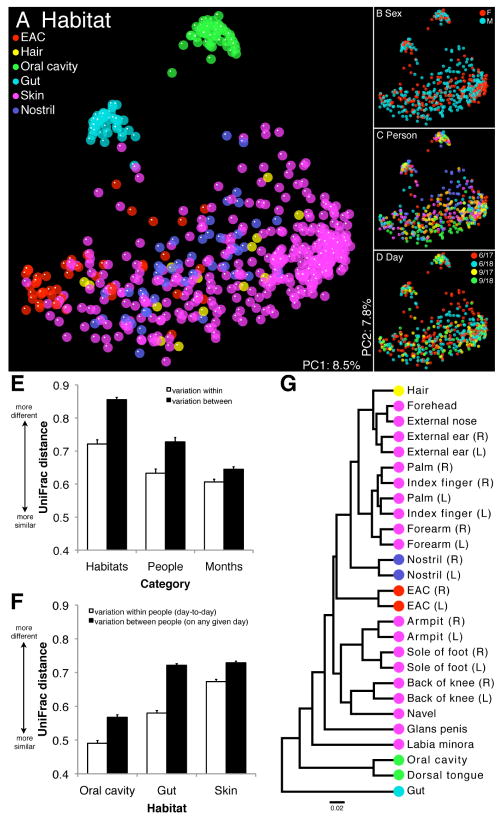
Fig. 1.
16S rRNA gene surveys reveal hierarchical partitioning of human-associated bacterial diversity. (A to D) Communities clustered using PCoA of the unweighted UniFrac distance matrix. Each point corresponds to a sample colored by (A) body habitat, (B) host sex, (C) host individual, or (D) collection date. The same plot is shown in each panel. F, female; M, male. (E and F) Mean (± SEM) unweighted UniFrac distance between communities. In (E) habitats are weighted equally and in (F) skin comparisons are within sites. (G) UPGMA clustering of composite communities from the indicated locales. Leaves are colored according to body habitat as in (A). R, right; L, left.

