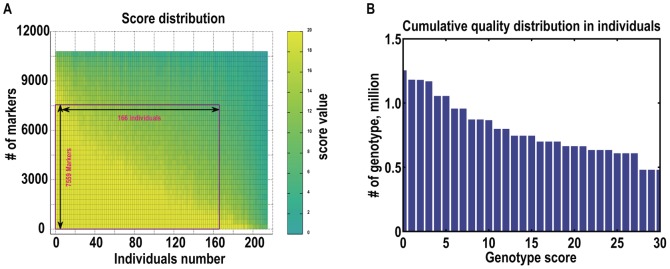
Figure 3. Genotyping quality in common F1 population.

The genotyping quality score was used to select qualified markers and individuals for subsequent analysis. This is a dynamic optimization process. We counted low-quality markers for each SLAF marker and for each individual, and deleted the worst marker or individual. We repeated this process, deleting an individual or a marker each time until the average genotyping quality score of all SLAF markers reached the cutoff value, which was 13. (a)Detailed genotyping quality of SLAF-seqdata. (b) Cumulative quality score distribution of 7559 markers in 166 individuals.
