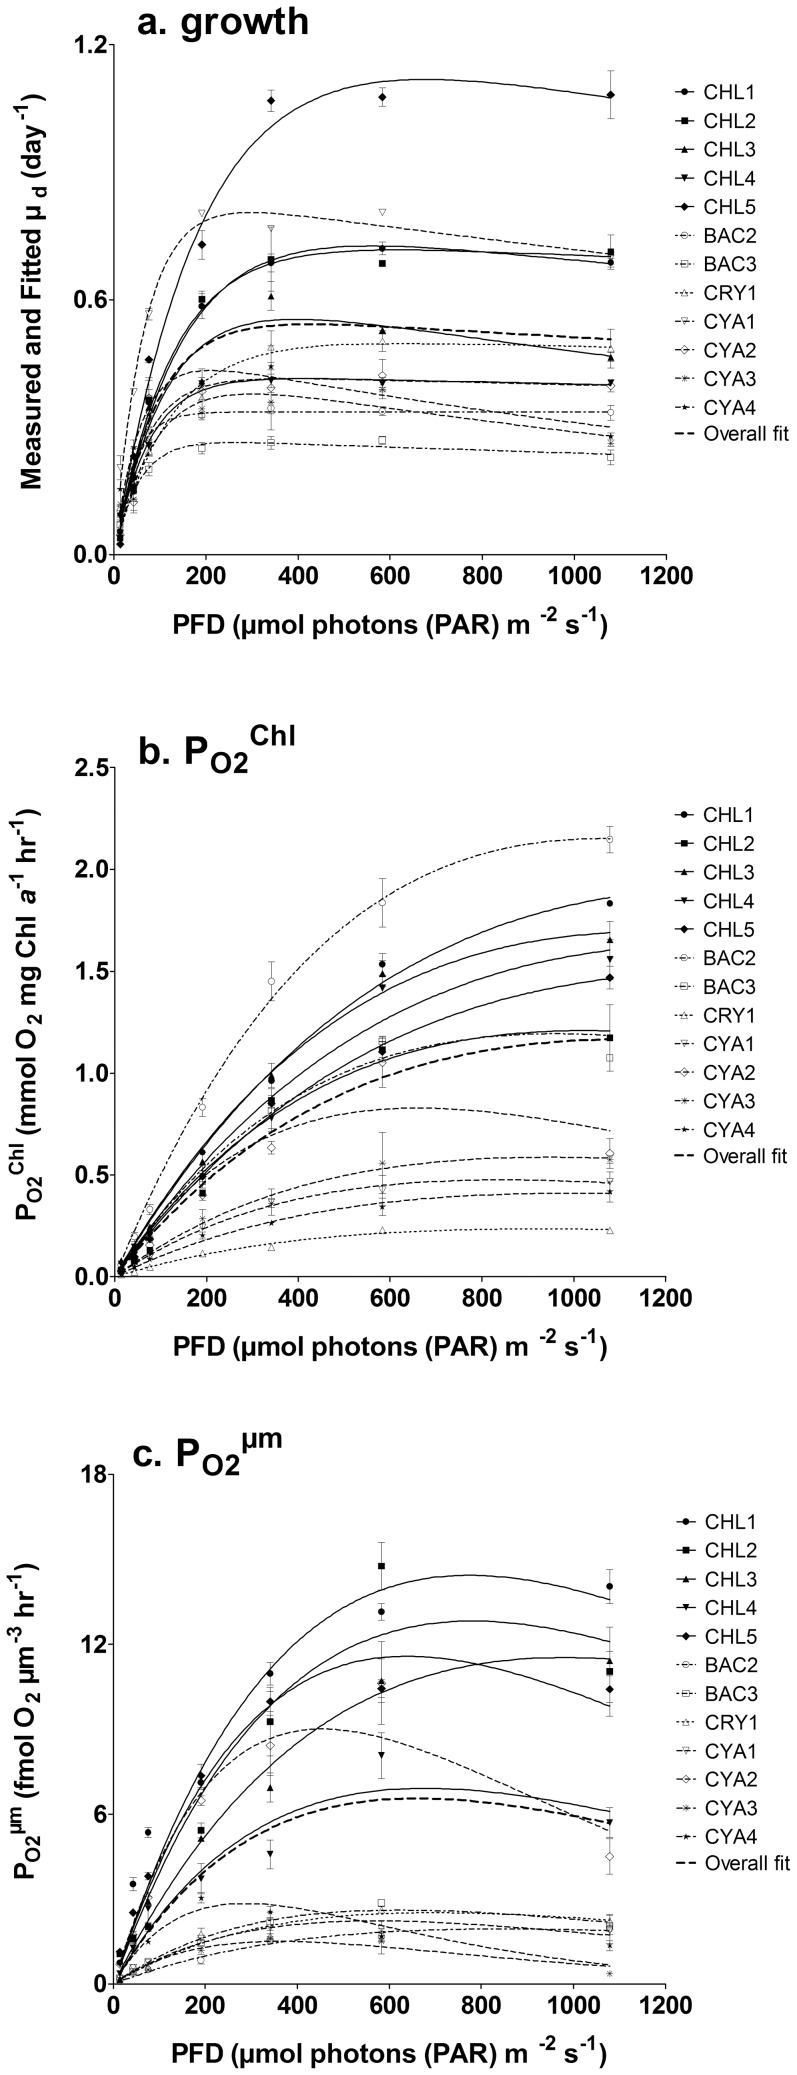
Figure 1. Responses of phytoplankton to light intensities; a. Cell division rate ( µd).
b. Oxygen production normalized to Chl a (PO2 Chl) or c. to biovolume (PO2 µm) obtained at each growing light intensities of photoacclimated phytoplankton (see Table 1 for the species list). The corresponding fits for growth or photosynthesis versus irradiance curve (PE curve) were obtained using eq. 1 (for µd) or eq. 4 (for PO2). Overall fit represents the result obtained for the whole data set.

