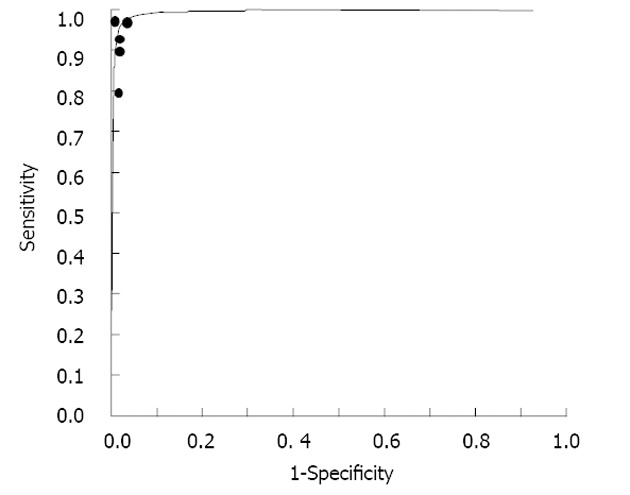
Figure 3.

Summary receiver operating characteristic curves for interferon-gamma assays. Solid circles represent each study included in the meta-analysis. The size of each study is indicated by the size of the solid circle. Summary receiver operating characteristic curves summarize the overall diagnostic accuracy.
