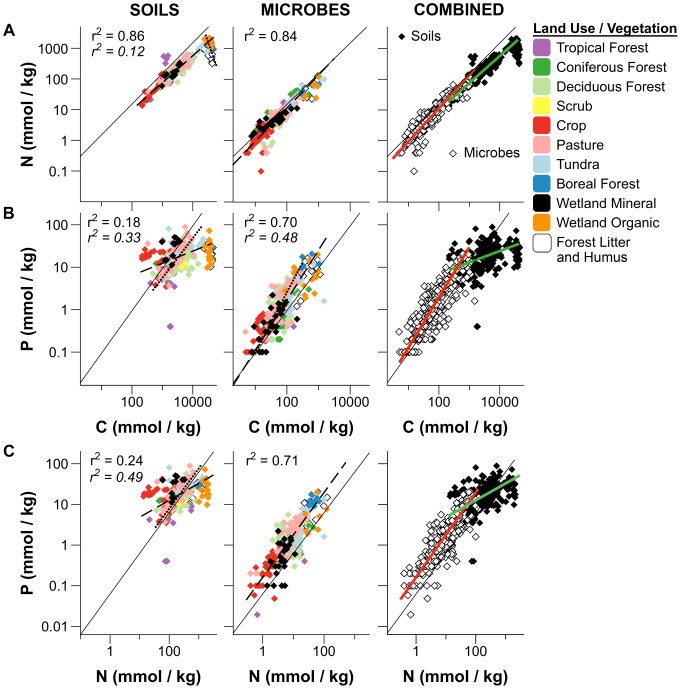
Figure 1. Global stoichiometric scaling of C, N, and P contents of soil and microbial biomass pools.
Relationships in plots show variation in A) C∶N ratios B) C∶P ratios C) N∶P ratios of soils, microbial biomass, and combined data. Data were log10 transformed transformed to improve normality and plotted to express size dependent relationships in comparison to the Redfield (1958) ratios (solid black lines). Dashed lines are regression fits for all global soils, with correlation coeficients in plain text and parameters estimated by SMA given in Table 1. Global relationships were compared with fits obtained using different subsets of habitat types, and where slopes were significantly different we plotted fits as dotted lines, with correlation coeficients given in italics. Soil C∶N scaling (A) was different in litter and organic soils (wetland organic, boreal forest, and humic horizons), while forest and pasture soils were different from global relationships in soil and microbial C∶P (B) and soil N∶P (C). SMA regression parameters for these relationships using subsets of our data are given in Table S1.

