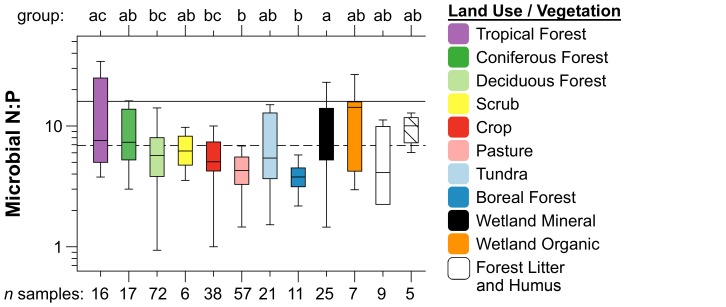
Figure 2. Differences in N∶P stoichiometry of soil microbial biomass among global vegetation and land use categories.
Letters on x-axis above the plot show group differences among vegetation types (using Tukey's tests), and number of samples for each vegetation type are given on the lower x-axis. Overall variance described by vegetation (R2 = 0.193, p<0.001) was determined using a general linear model. Solid horizontal line is the Redfield (1958) ratio N∶P = 16∶1, dashed line is average microbial N∶P (6.9) reported in [10].

