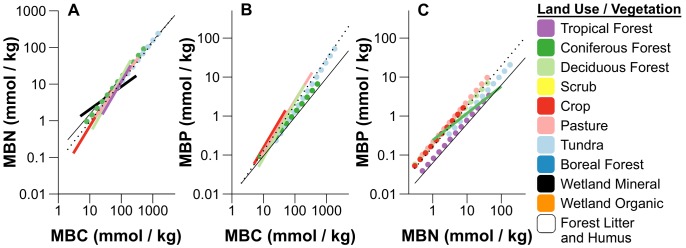
Figure 3. Estimated differences in stoichiometric scaling of microbial C, N, and P by land use/vegetation categories.

Estimated SMA regression fit lines for each land use and vegetation category are shown to express habitat level differences in scaling of microbial biomass A) C∶N ratios, B) C∶P ratios, and C) N∶P ratios, with data log10 transformed for normality. Bold lines are colored by land use and vegetation category, and treatments without significant fits are not shown. Colored solid lines indicate relationships where slopes were not equal to 1, while slopes not significantly different from 1 are are displayed as bold colored dotted lines. Thin black dotted lines show the regression fits for all groups combined (the same as in Fig. 1), while thin black solid lines indicate the Redfield ratios (C∶N∶P = 106∶16∶1). Individual plots for each regression fit by land use and vegetation categories are given in Figure S4, with parameters estimated by SMA provided in Tables S3, S4, S5, along with results of intercept and slope tests, and multiple comparisons of these parameters.
