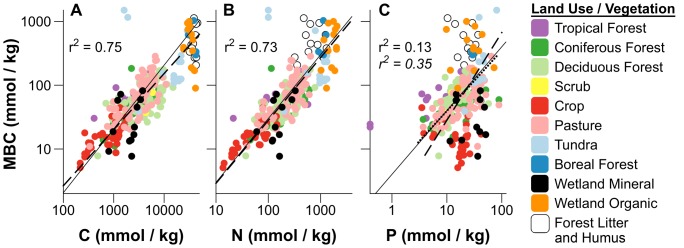
Figure 4. Scaling of soil microbial biomass C (MBC) with soil C, N, and P pools.

Relationships in plots show variation in MBC with A) soil C, B) soil N, and C) soil P. Outliers from the general relationship between MBC and soil C in A), including floodplain mineral soils [95] and arctic tundra [96] were removed prior to fitting regressions, and data were log10 transformed to improve normality. Solid lines are the 1∶1 isometric lines based on the geometric mean ratio of each scaling relationship. Dashed lines are regression fits for all global soils, with correlation coeficients in plain text and parameters estimated by SMA given in Table 1. Global relationships were compared with fits obtained using only data from forests and pastures, and where slopes were significantly different from all combined treatments we plotted fits as dotted lines, with correlation coeficients given in italics. SMA regression parameters fit using only forest and pasture soils are given in Table S1. Regressions were also tested seperately with only litter and organic soils data, but were these relationships were not significant.
