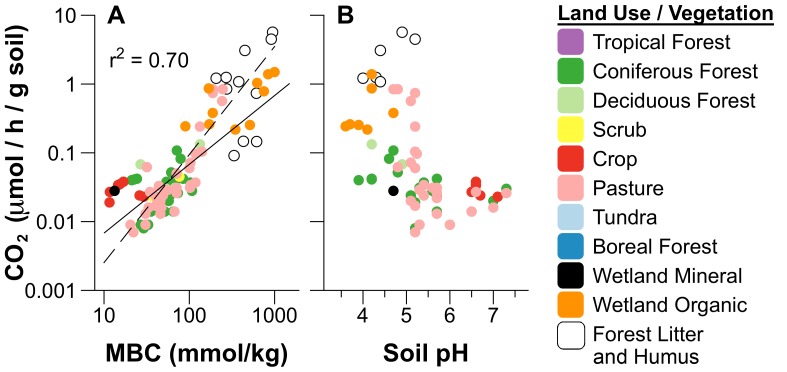
Figure 5. Carbon mineralization rates (CO2) varied with A) microbial biomass C (MBC) and B) soil pH.
C mineralization rates were measured in glass jar incubations in studies with concurrent measurements of microbial biomass C, N, and P. Dashed line in A) is the regression fit, and solid line is the 1∶1 isometric line based on the geometric mean ratio of CO2 to MBC (mean qCO2). Parameters estimated by SMA are given in Table 1. SMA regressions fit using only forest and pasture soils (parameters in Table S1) are not shown as they were essentially the same as the global relationships.

