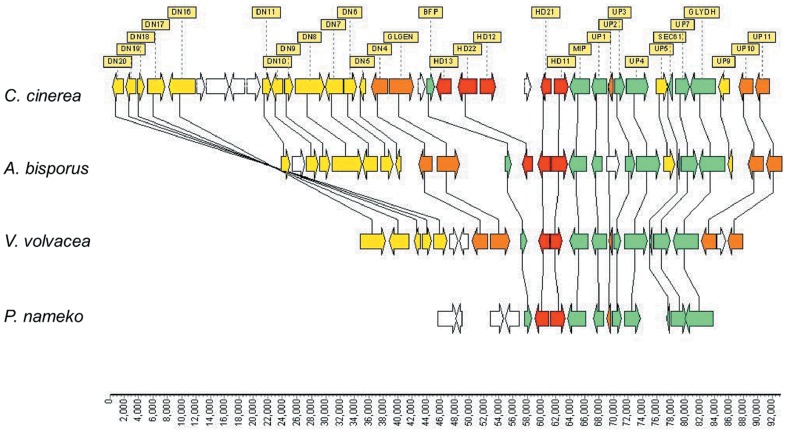
Figure 3. Comparison of the genomic structure of A mating type locus and its flanking region among C. cinerea, A. bisporus, V. volvacea and P. nameko.
Homologous genes are connected with lines. Arrows indicate the putative direction of transcription. Homeodomain protein genes (HD genes) are shown as red boxes. Green boxes indicate genes that are conserved among four species. Orange boxes indicate genes that are conserved among three species. Yellow boxes indicate genes that are conserved between two species. White boxes indicate genes that are not conserved among the four species. Data stem from C. cinerea (positions 2602748-2694125 from NCBI GenBank accession no. AACS02000001), A. bisporus (positions 862530-932075 from scaffold 1 in JGI Agaricus bisporus genome sequence, http://genome.jgi.doe.gov/Agabi_varbisH97_2/Agabi_varbisH97_2.home.html), V. volvacea (positions 379806-432904 from scaffold 7, HD1 position 406228–407814 and HD2 position 406060–404643) and P. nameko (positions 1734–39882 from NCBI GenBank accession no. AB435542).

