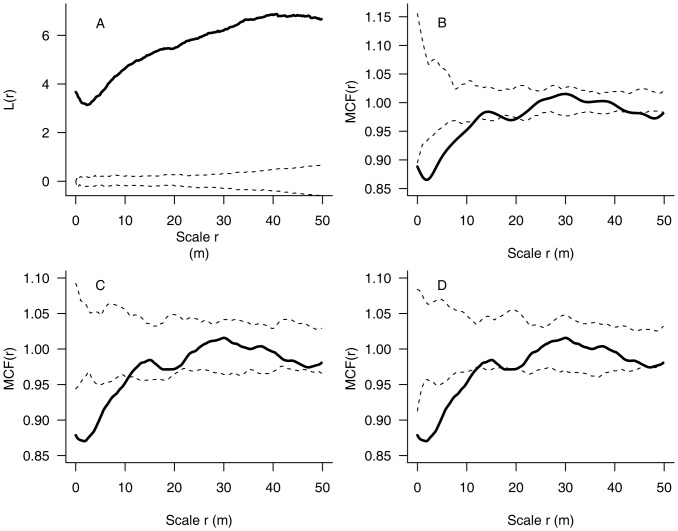
Figure 2. Exemplary results for Syringa reticulata var. amurensis to illustrate the analysis.
Diagram a presents the spatial distribution pattern using the L function. Diagrams b, c and d show the spatial characteristics of the diameter distribution evaluated by the mark correlation function. The significance of a and b was tested by the homogeneous Poisson model, c by the random labeling model, and d by the heterogeneous Poisson model. Dashed lines indicate the confidence envelopes, while solid lines indicate the L or MCF values calculated from the observations. When the solid line was below the lower envelope, inside both envelopes, or above the upper envelope, the pattern was assumed to be significantly regular, spatially random, or significantly aggregated in the L-function analysis. Correspondingly, a solid line above the upper envelope, inside both envelopes, or below the lower envelope, indicates significant positive, independent, or negative correlation of dbh marks in the MCF analysis.

