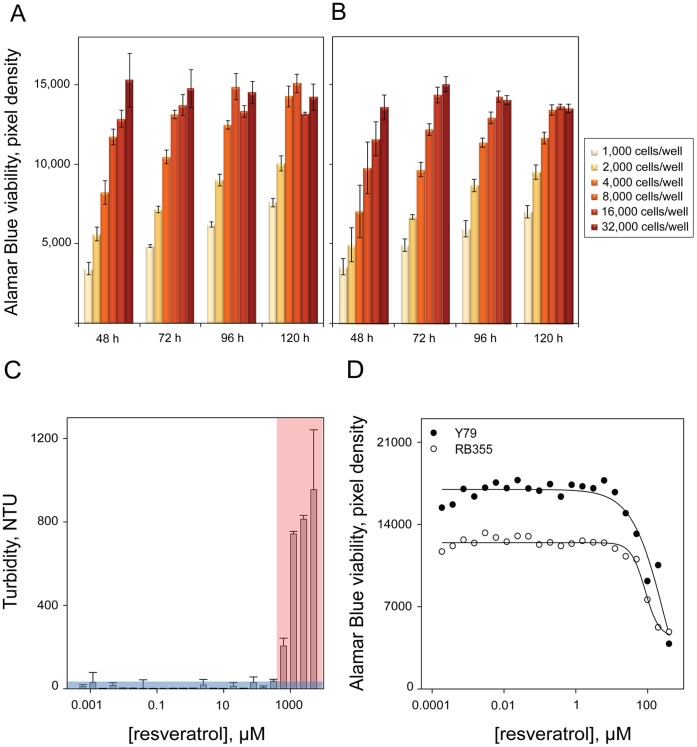
Figure 1. Optimization of a viability-based assay for the identification of compounds synergizing with resveratrol.
Optimization of an Alamar Blue-based viability assay with the retinoblastoma cell lines Y79 and RB355 in 384-well format. Bar graph summarizing the growth kinetics of A) Y79 and B) RB355 cells over a time course of 120 hours and identifying 4,000 cells per well as the optimal cell seeding density for both cell lines. C) Assessment of the aqueous solubility limit of resveratrol using laser nephelometry, defined as 400 µM based on a threshold consisting of the average turbidity value of control buffer +3 standard deviations (blue). Calibration curve for turbidity standards. D) Dose response curve of resveratrol toward Y79 and RB355 cells using previously optimized assay conditions. Resveratrol induces approximately 50% reduction in viability for both cell lines at 80 µM and this concentration is therefore selected as the optimal resveratrol concentration for screening.

